A) both the long-run aggregate supply curve and the long-run Phillips curve
B) the long-run aggregate supply curve, but not the long-run Phillips curve
C) the long-run Phillips curve, but not the long-run aggregate supply curve
D) neither the long-run Phillips curve nor the long-run aggregate supply curve
F) B) and D)
Correct Answer

verified
Correct Answer
verified
Multiple Choice
Figure 35-4. The left-hand graph shows a short-run aggregate-supply (SRAS) curve and two aggregate-demand (AD) curves. On the left-hand diagram, the price level is measured on the vertical axis; on the right-hand diagram, the inflation rate is measured on the vertical axis. 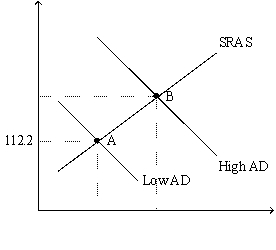
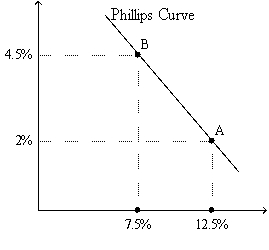 -Refer to Figure 35-4. What is measured along the horizontal axis of the left-hand graph?
A) the wage rate
B) the inflation rate
C) output
D) the interest rate
F) None of the above
Correct Answer

verified
Correct Answer
verified
Multiple Choice
Friedman and Phelps concluded that
A) in the long run the Phillips curve is downward sloping, which is consistent with classical theory.
B) in the long run the Philips curve is downward sloping, which is inconsistent with classical theory.
C) in the long run the Phillips curve is vertical, which is consistent with classical theory.
D) in the long run the Phillips curve is vertical, which is inconsistent with classical theory.
F) A) and D)
Correct Answer

verified
Correct Answer
verified
True/False
A given short-run Phillips curve shows that an increase in the inflation rate will be accompanied by a lower unemployment rate in the short run.
B) False
Correct Answer

verified
Correct Answer
verified
Multiple Choice
A. W. Phillips' findings were based on data
A) from 1861-1957 for the United Kingdom.
B) from 1861-1957 for the United States.
C) mostly from the post-World War II period in the United Kingdom.
D) mostly from the post-World War II period in the United States.
F) All of the above
Correct Answer

verified
Correct Answer
verified
Multiple Choice
If the central bank decreases the money supply, then in the short run prices
A) rise and unemployment falls.
B) fall and unemployment rises.
C) and unemployment rise.
D) and unemployment fall.
F) A) and B)
Correct Answer

verified
Correct Answer
verified
Multiple Choice
Economist A.W. Phillips found a negative correlation between
A) output and unemployment.
B) unemployment and the interest rate.
C) output and the interest rate.
D) wage inflation and unemployment.
F) B) and D)
Correct Answer

verified
Correct Answer
verified
Multiple Choice
Figure 35-1. The left-hand graph shows a short-run aggregate-supply (SRAS) curve and two aggregate-demand (AD) curves. On the right-hand diagram, U represents the unemployment rate. 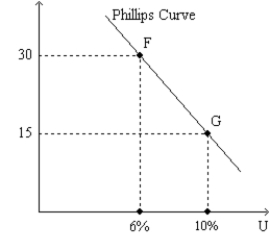
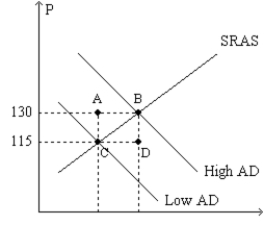 -Refer to Figure 35-1. What is measured along the vertical axis of the right-hand graph?
A) the interest rate
B) the inflation rate
C) the wage rate
D) the growth rate of the nominal money supply
F) B) and D)
Correct Answer

verified
Correct Answer
verified
Multiple Choice
A movement to the right along a given short-run Phillips curve could be caused by
A) an increase in the natural rate of unemployment or expansionary monetary policy.
B) expansionary monetary policy, but not an increase in the natural rate of unemployment.
C) an increase in the natural rate of unemployment or a contractionary monetary policy.
D) contractionary monetary policy, but not an increase in the natural rate of unemployment.
F) A) and B)
Correct Answer

verified
Correct Answer
verified
Multiple Choice
Figure 35-4. The left-hand graph shows a short-run aggregate-supply (SRAS) curve and two aggregate-demand (AD) curves. On the left-hand diagram, the price level is measured on the vertical axis; on the right-hand diagram, the inflation rate is measured on the vertical axis. 
 -Refer to Figure 35-4. What is measured along the horizontal axis of the right-hand graph?
A) the interest rate
B) the price level
C) the government's budget deficit as a percent of GDP
D) the unemployment rate
F) A) and B)
Correct Answer

verified
Correct Answer
verified
Multiple Choice
Which of the following is downward-sloping?
A) both the long-run Phillips curve and the short-run Phillips curve
B) neither the long-run Phillips curve nor the short-run Phillips curve
C) the long-run Phillips curve, but not the short-run Phillips curve
D) the short-run Phillips curve, but not the long-run Phillips curve
F) A) and C)
Correct Answer

verified
Correct Answer
verified
Multiple Choice
Which of the following would not be associated with a favorable supply shock?
A) the short-run Phillips curve shifts left
B) unemployment falls
C) the price level rises
D) output rises.
F) C) and D)
Correct Answer

verified
Correct Answer
verified
True/False
The proliferation of Internet usage serves as an example of a favorable supply shock.
B) False
Correct Answer

verified
Correct Answer
verified
Multiple Choice
Data for the United States traced out an almost perfect Phillips curve for much of the
A) 1960s.
B) 1970s.
C) 1980s.
D) 1990s.
F) B) and D)
Correct Answer

verified
Correct Answer
verified
Multiple Choice
As an economist working for a U.S. government agency you determine that a particular country has a sacrifice ratio of 3. Policy-makers in that country are thinking of lowering the inflation rate from 10% to 4%. Is this sacrifice ratio higher or lower than the typical estimate? From your numbers, what is the amount of output that will be lost for this country to reduce its inflation rate?
A) The sacrifice ratio is higher than the typical estimate. It will cost 30% of annual output to reach the new inflation target.
B) The sacrifice ratio is higher than the typical estimate. It will cost 18% of annual output to reach the new inflation target.
C) The sacrifice ratio is lower than the typical estimate. It will cost 30% of annual output to reach the new inflation target.
D) The sacrifice ratio is lower than the typical estimate. It will cost 18% of annual output to reach the new inflation target.
F) All of the above
Correct Answer

verified
Correct Answer
verified
True/False
A central bank announces it will decrease the inflation rate by 10 percentage points. People are skeptical of the announcement, but do expect the central bank will reduce inflation by 5 percentage points and so expected inflation falls by 5 percentage points. If the central bank decreases inflation by only 3 percentage points then the unemployment rate will fall.
B) False
Correct Answer

verified
Correct Answer
verified
Multiple Choice
If more firms chose to pay efficiency wages, which of the following would shift to the right?
A) both the long-run Phillips curve and the long-run aggregate supply curve
B) the long-run Phillips curve but not the long-run aggregate supply curve
C) the long-run aggregate supply curve but not the long-run Phillips curve
D) neither the long-run Phillips curve nor the long-run aggregate supply curve
F) B) and C)
Correct Answer

verified
Correct Answer
verified
Multiple Choice
An increase in the price of oil shifts the
A) short-run Phillips curve right and the unemployment rate rises.
B) short-run Phillips curve right and the unemployment rate falls.
C) short-run Phillips curve left and the unemployment rate rises.
D) short-run Phillips curve left and the unemployment rate falls.
F) All of the above
Correct Answer

verified
Correct Answer
verified
Multiple Choice
Which of the following would we not expect if government policy moved the economy up along a given short-run Phillips curve?
A) Teresa reads in the newspaper that the central bank recently raised the money supply.
B) Jackie gets fewer job offers.
C) Miguel makes larger increases in the prices at his health food store.
D) Julie's nominal wage increase is larger.
F) B) and C)
Correct Answer

verified
Correct Answer
verified
Multiple Choice
Figure 35-6
Use the graph below to answer the following questions. 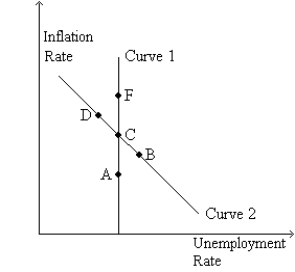 -Refer to Figure 35-6. If the economy starts at C and the money supply growth rate increases, in the long run the economy
A) stays at C.
B) moves to B.
C) moves to F.
D) None of the above is consistent wit an increase in the money supply growth rate.
F) A) and C)
Correct Answer

verified
Correct Answer
verified
Showing 121 - 140 of 491
Related Exams