A) goods and services, households and firms are both sellers.
B) goods and services, households are buyers and firms are sellers.
C) the factors of production, households are buyers and firms are sellers.
D) the factors of production, households and firms are both buyers.
F) All of the above
Correct Answer

verified
Correct Answer
verified
Multiple Choice
Figure 2-16 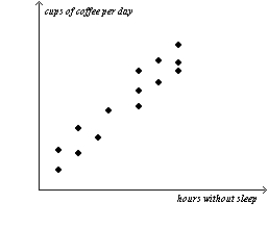 -Refer to Figure 2-16. Cups of coffee per day and the hours that someone can go without sleep appear to have
A) a positive correlation.
B) a negative correlation.
C) a random correlation.
D) no correlation.
F) B) and C)
Correct Answer

verified
Correct Answer
verified
Multiple Choice
When a relevant variable that is not named on either axis changes,
A) there will be a movement along the curve.
B) the curve will rotate clockwise.
C) the curve will be unaffected since only the variables on the axis affect the curve.
D) the curve will shift.
F) B) and D)
Correct Answer

verified
Correct Answer
verified
Multiple Choice
Economists, like mathematicians, physicists, and biologists,
A) make use of the scientific method.
B) try to address their subject with a scientist's objectivity.
C) devise theories, collect data, and then analyze these data in an attempt to verify or refute their theories.
D) All of the above are correct.
F) A) and C)
Correct Answer

verified
Correct Answer
verified
True/False
Figure 2-23 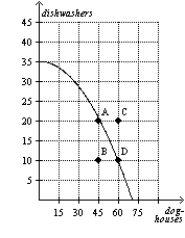 -Refer to Figure 2-23. Points B and C represent infeasible outcomes for this economy.
B) False
Correct Answer

verified
Correct Answer
verified
Multiple Choice
Figure 2-4 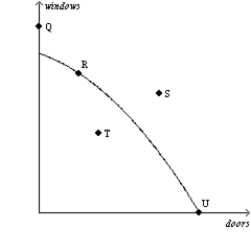 -Refer to Figure 2-4. Efficient production is represented by which point(s) ?
A) Q, R, U
B) R, T, U
C) R, U
D) S, T
F) None of the above
Correct Answer

verified
Correct Answer
verified
Multiple Choice
Economists make assumptions to
A) mimic the methodologies employed by other scientists.
B) minimize the number of experiments that yield no useful data.
C) minimize the likelihood that some aspect of the problem at hand is being overlooked.
D) focus their thinking on the essence of the problem at hand.
F) B) and D)
Correct Answer

verified
Correct Answer
verified
Multiple Choice
The circular-flow diagram
A) is an economic model.
B) incorporates two types of decision makers: households and firms.
C) represents the flows of inputs, outputs, and dollars.
D) All of the above are correct.
F) All of the above
Correct Answer

verified
Correct Answer
verified
True/False
Figure 2-23  -Refer to Figure 2-23. The opportunity cost of an additional doghouse increases as more doghouses are produced.
B) False
Correct Answer

verified
Correct Answer
verified
Multiple Choice
Differences in scientific judgement between economists are similar to all of the following except
A) astronomers debating whether the sun or earth was at the center of the solar system.
B) meteorologists debating the existence of global warming.
C) two politicians arguing about the fairness of the tax code.
D) explorers debating whether or not the earth was flat before the time of Christopher Columbus.
F) B) and D)
Correct Answer

verified
Correct Answer
verified
Multiple Choice
John Maynard Keynes referred to economics as an easy subject,
A) at which very few excel.
B) but not as easy as philosophy or the pure sciences.
C) which very few can enjoy.
D) which deals primarily with common sense.
F) A) and C)
Correct Answer

verified
Correct Answer
verified
Short Answer
The institution that sets the nation's monetary policy is called the
Correct Answer

verified
Correct Answer
verified
True/False
Economists work both inside and outside the administrative branch of the U.S. government.
B) False
Correct Answer

verified
Correct Answer
verified
Multiple Choice
Which of the following is not correct?
A) Evaluating statements about how the world should be involves values as well as facts.
B) Positive statements can, in principle, be confirmed or refuted by examining evidence.
C) Normative statements can be judged using data alone.
D) Deciding what is good or bad policy is not just a matter of science.
F) All of the above
Correct Answer

verified
Correct Answer
verified
Multiple Choice
Economic models
A) are people who act out the behavior of firms and households so that economists can study this behavior.
B) are usually detailed replications of reality.
C) incorporate simplifying assumptions that often contradict reality, but also help economists better understand reality.
D) are useful to researchers but not to teachers because economic models omit many details of the real-world economy.
F) A) and C)
Correct Answer

verified
Correct Answer
verified
Multiple Choice
The x-coordinate of an ordered pair specifies the
A) diagonal location of the point.
B) vertical location of the point.
C) horizontal location of the point.
D) quadrant location in which the point is located.
F) A) and B)
Correct Answer

verified
Correct Answer
verified
Multiple Choice
If Martina's income increases and, as a result, she chooses to buy more lattés per month at each price, then her demand curve will
A) shift to the right.
B) shift to the left.
C) not shift; instead, Martina will move along her demand curve downward and to the right.
D) not shift; instead, Martina will move along her demand curve upward and to the left.
F) All of the above
Correct Answer

verified
Correct Answer
verified
Short Answer
Figure 2-22 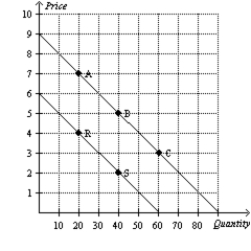 -Refer to Figure 2-22. Given that price is measured on the vertical axis, quantity is measured on the horizontal axis, and that the curves are downward-sloping, what type of curves are depicted here?
Correct Answer

verified
Correct Answer
verified
Multiple Choice
Figure 2-5 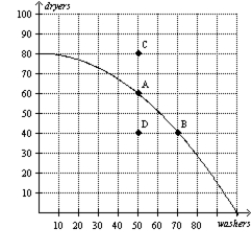 -Refer to Figure 2-5. This economy cannot currently produce 70 washers and 70 dryers because
A) it is not using all of its resources.
B) it is not using the most efficient production process.
C) it does not have the resources and technology to produce that level of output.
D) All of the above are correct.
F) B) and C)
Correct Answer

verified
Correct Answer
verified
True/False
In the circular-flow diagram, one loop represents the flow of goods and services, and the other loop represents the flow of factors of production.
B) False
Correct Answer

verified
Correct Answer
verified
Showing 341 - 360 of 617
Related Exams