B) False
Correct Answer

verified
Correct Answer
verified
True/False
Use the following Figure to answer the question : Figure 2-23 : 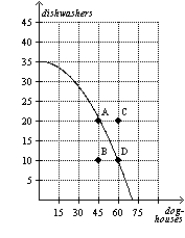 -Refer to Figure 2-23. It is possible for this economy to produce 75 doghouses.
B) False
Correct Answer

verified
Correct Answer
verified
Multiple Choice
In the circular-flow diagram, which of the following items flows from households to firms through the markets for goods and services?
A) goods and services
B) dollars paid to land, labor, and capital
C) dollars spent on goods and services
D) wages, rent, and profit
F) B) and C)
Correct Answer

verified
Correct Answer
verified
Multiple Choice
Use the following Figure to answer the question Figure: 2-1 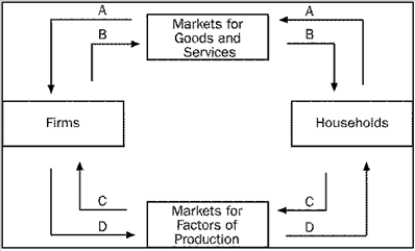 -Refer to Figure 2-1. Which arrow represents the flow of spending by households?
A) A
B) B
C) C
D) D
F) C) and D)
Correct Answer

verified
Correct Answer
verified
Multiple Choice
The opportunity cost of obtaining more of one good is shown on the production possibilities frontier as the
A) amount of the other good that must be given up.
B) market price of the additional amount produced.
C) amount of resources that must be devoted to its production.
D) number of dollars that must be spent to produce it.
F) C) and D)
Correct Answer

verified
Correct Answer
verified
Multiple Choice
When constructing a production possibilities frontier, which of the following assumptions is not made?
A) The economy produces only two goods or two types of goods.
B) Firms produce goods using factors of production.
C) The technology available to firms is given.
D) The quantities of the factors of production that are available are increasing over the relevant time period.
F) C) and D)
Correct Answer

verified
Correct Answer
verified
True/False
Since 1946, the president of the United States has received guidance from the Council of Economic Advisers.
B) False
Correct Answer

verified
Correct Answer
verified
Multiple Choice
A macroeconomist - as opposed to a microeconomist - might study the effect of
A) changes in the money supply on the inflation rate.
B) an increase in the gas tax on fuel consumption.
C) a technological advance on the natural gas industry.
D) a hurricane on prices in the orange industry.
F) A) and C)
Correct Answer

verified
Correct Answer
verified
Multiple Choice
Use the following Figure to answer the question Figure: 2-1  -Refer to Figure 2-1. Which arrow represents the flow of goods and services?
A) A
B) B
C) C
D) D
F) A) and B)
Correct Answer

verified
Correct Answer
verified
Multiple Choice
The circular-flow diagram is a
A) visual model of the economy.
B) visual model of the relationships among money, prices, and businesses.
C) model that shows the effects of government on the economy.
D) mathematical model of how the economy works.
F) A) and B)
Correct Answer

verified
Correct Answer
verified
Multiple Choice
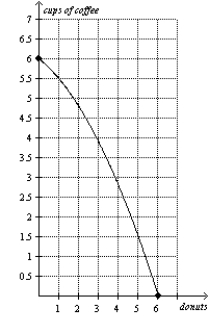
Use the following Figure to answer the question : Figure 2-9
Panel a)
 Panel b)
 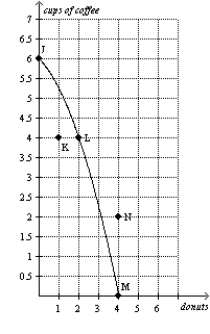 -Refer to Figure 2-9, Panel a) . Production at point K is
A) possible and efficient.
B) possible but inefficient.
C) impossible but efficient.
D) impossible and inefficient.
F) A) and C)
Correct Answer

verified
Correct Answer
verified
Multiple Choice
Use the following Figure to answer the question : Figure 2-17 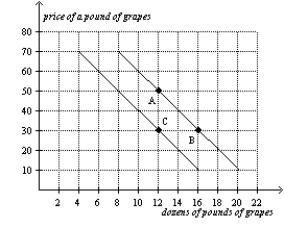 -Refer to Figure 2-17. The movement from point B to point C could have been caused by
A) inflation.
B) a change in income.
C) a change in the price of grapes.
D) a change in the cost of producing grapes.
F) A) and C)
Correct Answer

verified
Correct Answer
verified
Multiple Choice
Economists view positive statements as
A) affirmative, justifying existing economic policy.
B) optimistic, putting the best possible interpretation on things.
C) descriptive, making a claim about how the world is.
D) prescriptive, making a claim about how the world ought to be.
F) None of the above
Correct Answer

verified
Correct Answer
verified
Multiple Choice
Use the following Figure to answer the question : Figure 2-8 :
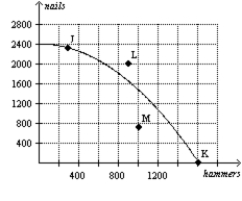 -Refer to Figure 2-8. To reach point L, the economy would have to
A) acquire more resources or experience a technological advance.
B) begin using its available resources more efficiently than it is currently using them.
C) shift resources away from the production of nails and toward the production of hammers.
D) None of the above are correct; the economy will never be able to reach point L.
F) C) and D)
Correct Answer

verified
Correct Answer
verified
Multiple Choice
A model can be accurately described as a
A) theoretical abstraction with very little value.
B) device that is useful only to the people who created it.
C) realistic and carefully constructed theory.
D) simplification of reality.
F) B) and C)
Correct Answer

verified
Correct Answer
verified
True/False
The Council of Economic Advisers consists of thirty members and a staff of several dozen economists.
B) False
Correct Answer

verified
Correct Answer
verified
True/False
Economists usually have to make do with whatever data the world happens to give them.
B) False
Correct Answer

verified
Correct Answer
verified
Multiple Choice
Which of these terms are used interchangeably?
A) "goods and services" and "inputs"
B) "goods and services" and "factors of production"
C) "inputs" and "factors of production"
D) "land, labor, and capital" and "goods and services"
F) B) and C)
Correct Answer

verified
Correct Answer
verified
True/False
Economists devise theories, collect data, and then analyze these data in an attempt to verify or refute their theories.
B) False
Correct Answer

verified
Correct Answer
verified
Multiple Choice
Which of the following allows you to provide information about the relationship between two variables?
A) coordinate system.
B) pie chart
C) bar graph
D) time-series graph
F) A) and B)
Correct Answer

verified
Correct Answer
verified
Showing 521 - 540 of 615
Related Exams