A) a decrease in supply
B) an increase in demand
C) a surplus of the good
D) a shortage of the good
F) A) and B)
Correct Answer

verified
Correct Answer
verified
Multiple Choice
What will happen in the artichoke market now if buyers expect higher artichoke prices in the near future?
A) The demand for artichokes will increase.
B) The demand for artichokes will decrease.
C) The demand for artichokes will be unaffected.
D) The supply of artichokes will increase.
F) B) and D)
Correct Answer

verified
Correct Answer
verified
True/False
An increase in the price of ink will shift the supply curve for pens to the left.
B) False
Correct Answer

verified
Correct Answer
verified
Multiple Choice
In markets,prices move toward equilibrium because of
A) the actions of buyers and sellers.
B) government regulations placed on market participants.
C) increased competition among sellers.
D) buyers' ability to affect market outcomes.
F) A) and D)
Correct Answer

verified
Correct Answer
verified
True/False
A shortage will occur at any price below equilibrium price and a surplus will occur at any price above equilibrium price.
B) False
Correct Answer

verified
Correct Answer
verified
True/False
In a perfectly competitive market,buyers and sellers are price setters.
B) False
Correct Answer

verified
Correct Answer
verified
Multiple Choice
In a perfectly competitive market,at the market price,buyers
A) cannot buy all they want,and sellers cannot sell all they want.
B) cannot buy all they want,but sellers can sell all they want.
C) can buy all they want,but sellers cannot sell all they want.
D) can buy all they want,and sellers can sell all they want.
F) A) and B)
Correct Answer

verified
Correct Answer
verified
Multiple Choice
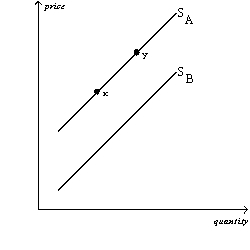
Figure 4-2
The graph below pertains to the supply of paper to colleges and universities.
 -Refer to Figure 4-2.All else equal,an increase in the price of the pulp used in the paper production process would cause a move from
A) x to y.
B) y to x.
C) SA to SB.
D) SB to SA.
F) None of the above
Correct Answer

verified
Correct Answer
verified
True/False
The law of demand states that,other things equal,when the price of a good rises,the quantity demanded of the good falls,and when the price falls,the quantity demanded rises.
B) False
Correct Answer

verified
Correct Answer
verified
Multiple Choice
Which of the following would shift the demand curve for gasoline to the right?
A) a decrease in the price of gasoline
B) an increase in consumer income,assuming gasoline is a normal good
C) an increase in the price of cars,a complement for gasoline
D) a decrease in the expected future price of gasoline
F) B) and C)
Correct Answer

verified
Correct Answer
verified
True/False
A decrease in income will shift the demand curve for an inferior good to the right.
B) False
Correct Answer

verified
Correct Answer
verified
Multiple Choice
The difference between a supply schedule and a supply curve is that a supply schedule
A) incorporates demand and a supply curve does not.
B) incorporates profit and a supply curve does not.
C) can shift,but a supply curve cannot shift.
D) is a table,and a supply curve is drawn on a graph.
F) C) and D)
Correct Answer

verified
Correct Answer
verified
True/False
A market is a group of buyers and sellers of a particular good or service.
B) False
Correct Answer

verified
Correct Answer
verified
True/False
An increase in the price of a product and an increase in the number of sellers in the market affect the supply curve in the same general way.
B) False
Correct Answer

verified
Correct Answer
verified
Multiple Choice
The quantity supplied of a good is the amount that
A) buyers are willing and able to purchase.
B) sellers are able to produce.
C) buyers and sellers agree will be brought to market.
D) sellers are willing and able to sell.
F) A) and B)
Correct Answer

verified
Correct Answer
verified
Multiple Choice
Table 4-1 -Refer to Table 4-1.Which of the following illustrates the market demand curve?
A) ![]()
B) ![]()
C) ![]()
D) ![]()
F) All of the above
Correct Answer

verified
Correct Answer
verified
Multiple Choice
Soup is an inferior good if the demand
A) for soup falls when the price of a substitute for soup rises.
B) for soup rises when the price of soup falls.
C) curve for soup slopes upward.
D) for soup falls when income rises.
F) A) and B)
Correct Answer

verified
Correct Answer
verified
Multiple Choice
An increase in quantity demanded
A) results in a movement downward and to the right along a demand curve.
B) results in a movement upward and to the left along a demand curve.
C) shifts the demand curve to the left.
D) shifts the demand curve to the right.
F) B) and C)
Correct Answer

verified
Correct Answer
verified
True/False
In a competitive market,the quantity of each good produced and the price at which it is sold are not determined by any single buyer or seller.
B) False
Correct Answer

verified
Correct Answer
verified
True/False
When a supply curve or a demand curve shifts,the equilibrium price and equilibrium quantity change.
B) False
Correct Answer

verified
Correct Answer
verified
Showing 21 - 40 of 59
Related Exams