A) in a market to buyers and sellers that is not offset by an increase in government revenue.
B) in revenue to the government when buyers choose to buy less of the product because of the tax.
C) of equality in a market due to government intervention.
D) of total revenue to business firms due to the price wedge caused by the tax.
F) A) and C)
Correct Answer

verified
Correct Answer
verified
Multiple Choice
Which of the following statements is true for markets in which the demand curve slopes downward and the supply curve slopes upward?
A) As the size of the tax increases, tax revenue continually rises and deadweight loss continually falls.
B) As the size of the tax increases, tax revenue and deadweight loss rise initially, but both eventually begin to fall.
C) As the size of the tax increases, tax revenue rises initially, but it eventually begins to fall; deadweight loss continually rises.
D) As the size of the tax increases, tax revenue rises initially, but it eventually begins to fall; deadweight loss falls initially, but eventually it begins to rise.
F) A) and D)
Correct Answer

verified
Correct Answer
verified
Multiple Choice
Taxes cause deadweight losses because taxes
A) reduce the sum of producer and consumer surpluses by more than the amount of tax revenue.
B) prevent buyers and sellers from realizing some of the gains from trade.
C) cause marginal buyers and marginal sellers to leave the market, causing the quantity sold to fall.
D) All of the above are correct.
F) All of the above
Correct Answer

verified
Correct Answer
verified
Multiple Choice
Figure 8-10 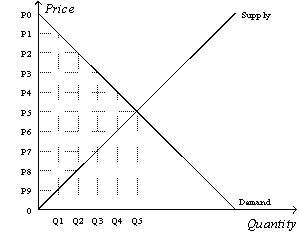 -Refer to Figure 8-10. Suppose the government imposes a tax that reduces the quantity sold in the market after the tax to Q2. Without the tax, the consumer surplus is
A) (P0-P2) x Q2.
B) x (P0-P2) x Q2.
C) (P0-P5) x Q5.
D) x (P0-P5) x Q5.
F) A) and C)
Correct Answer

verified
Correct Answer
verified
Multiple Choice
Figure 8-5
Suppose that the government imposes a tax of P3 - P1. 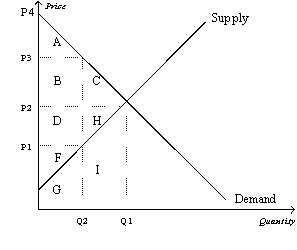 -Refer to Figure 8-5. The price that buyers effectively pay after the tax is imposed is
A) P1.
B) P2.
C) P3.
D) P4.
F) B) and D)
Correct Answer

verified
Correct Answer
verified
True/False
The optimal tax is difficult to determine because although revenues rise and fall as the size of the tax increases, deadweight loss continues to increase.
B) False
Correct Answer

verified
Correct Answer
verified
Multiple Choice
Figure 8-10 ![Figure 8-10 -Refer to Figure 8-10. Suppose the government imposes a tax that reduces the quantity sold in the market after the tax to Q2. Without the tax, the total surplus is A) [x (P0-P5) x Q5] + [x (P5-0) x Q5]. B) [x (P0-P2) x Q2] +[(P2-P8) x Q2] + [x (P8-0) x Q2]. C) (P2-P8) x Q2. D) x (P2-P8) x (Q5-Q2) .](https://d2lvgg3v3hfg70.cloudfront.net/TB4800/11ea67aa_efa6_5d1e_8b3b_4b4b0527e148_TB4800_00_TB4800_00_TB4800_00_TB4800_00_TB4800_00_TB4800_00_TB4800_00_TB4800_00_TB4800_00_TB4800_00_TB4800_00.jpg) -Refer to Figure 8-10. Suppose the government imposes a tax that reduces the quantity sold in the market after the tax to Q2. Without the tax, the total surplus is
-Refer to Figure 8-10. Suppose the government imposes a tax that reduces the quantity sold in the market after the tax to Q2. Without the tax, the total surplus is
A) [x (P0-P5) x Q5] + [x (P5-0) x Q5].
B) [x (P0-P2) x Q2] +[(P2-P8) x Q2] + [x (P8-0) x Q2].
C) (P2-P8) x Q2.
D) x (P2-P8) x (Q5-Q2) .
F) A) and B)
Correct Answer

verified
Correct Answer
verified
Multiple Choice
Figure 8-3
The vertical distance between points A and C represents a tax in the market. 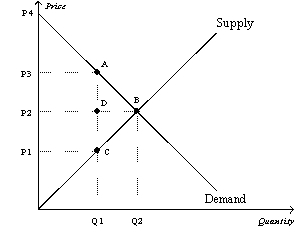 -Refer to Figure 8-3. The amount of tax revenue received by the government is equal to the area
A) P3ACP1.
B) ABC.
C) P2DAP3.
D) P1CDP2.
F) C) and D)
Correct Answer

verified
Correct Answer
verified
Multiple Choice
When a good is taxed, the burden of the tax
A) falls more heavily on the side of the market that is more elastic.
B) falls more heavily on the side of the market that is more inelastic.
C) falls more heavily on the side of the market that is closer to unit elastic.
D) is distributed independently of relative elasticities of supply and demand.
F) C) and D)
Correct Answer

verified
Correct Answer
verified
Multiple Choice
The price elasticities of supply and demand affect
A) both the size of the deadweight loss from a tax and the tax incidence.
B) the size of the deadweight loss from a tax but not the tax incidence.
C) the tax incidence but not the size of the deadweight loss from a tax.
D) neither the size of the deadweight loss from a tax nor the tax incidence.
F) A) and C)
Correct Answer

verified
Correct Answer
verified
Multiple Choice
Which of the following statements is correct regarding a tax on a good and the resulting deadweight loss?
A) The greater are the price elasticities of supply and demand, the greater is the deadweight loss.
B) The greater is the price elasticity of supply and the smaller is the price elasticity of demand, the greater is the deadweight loss.
C) The smaller are the decreases in quantity demanded and quantity supplied, the greater the deadweight loss.
D) The smaller is the wedge between the effective price to sellers and the effective price to buyers, the greater is the deadweight loss.
F) All of the above
Correct Answer

verified
Correct Answer
verified
Multiple Choice
When the government imposes taxes on buyers or sellers of a good, society
A) loses some of the benefits of market efficiency.
B) gains efficiency but loses equality.
C) is better off because the government's tax revenues exceed the deadweight loss.
D) moves from an elastic supply curve to an inelastic supply curve.
F) A) and C)
Correct Answer

verified
Correct Answer
verified
True/False
The greater the elasticity of demand, the smaller the deadweight loss of a tax.
B) False
Correct Answer

verified
Correct Answer
verified
True/False
The Laffer curve is the curve showing how tax revenue varies as the size of the tax varies.
B) False
Correct Answer

verified
Correct Answer
verified
Multiple Choice
Figure 8-2
The vertical distance between points A and B represents a tax in the market. 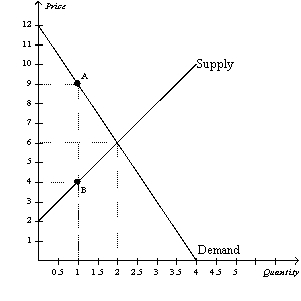 -Refer to Figure 8-2. The loss of producer surplus associated with some sellers dropping out of the market as a result of the tax is
A) $0.
B) $1.
C) $2.
D) $3.
F) A) and C)
Correct Answer

verified
Correct Answer
verified
Multiple Choice
Figure 8-1 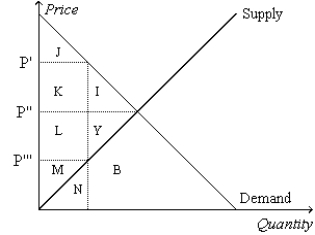 -Refer to Figure 8-1. Suppose the government imposes a tax of P' - P'''. The area measured by I+Y represents the
A) deadweight loss due to the tax.
B) loss in consumer surplus due to the tax.
C) loss in producer surplus due to the tax.
D) total surplus before the tax.
F) All of the above
Correct Answer

verified
Correct Answer
verified
Multiple Choice
Which of the following would likely have the smallest deadweight loss relative to the tax revenue?
A) a head tax (that is, a tax everyone must pay regardless of what one does or buys)
B) an income tax
C) a tax on compact discs
D) a tax on caviar
F) A) and B)
Correct Answer

verified
Correct Answer
verified
True/False
Economist Arthur Laffer made the argument that tax rates in the United States were so high that reducing the rates would increase tax revenue.
B) False
Correct Answer

verified
Correct Answer
verified
Multiple Choice
Figure 8-20. The figure represents the relationship between the size of a tax and the tax revenue raised by that tax. 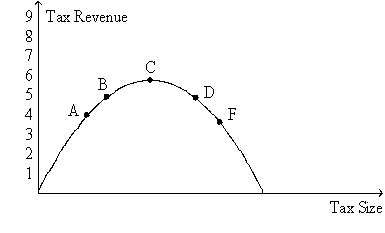 -Refer to Figure 8-20. Suppose the figure pertains to the labor tax, and suppose also that point B represents the position on the curve of the typical European country. Then, according to a recent research paper published by the European Central Bank, the position on the curve of the U.S. would most likely be point
A) A.
B) C.
C) D.
D) F.
F) None of the above
Correct Answer

verified
Correct Answer
verified
Multiple Choice
For good X, the supply curve is the typical upward-sloping straight line, and the demand curve is the typical downward-sloping straight line. A tax of $15 per unit is imposed on good X. The tax reduces the equilibrium quantity in the market by 300 units. The deadweight loss from the tax is
A) $1,750.
B) $2,250.
C) $3,000.
D) $4,500.
F) All of the above
Correct Answer

verified
Correct Answer
verified
Showing 61 - 80 of 422
Related Exams