A) Both wages and employment will increase.
B) Both wages and employment will decrease.
C) Wages will increase, and employment will decrease.
D) Wages will decrease, and employment will increase.
F) A) and B)
Correct Answer

verified
Correct Answer
verified
Multiple Choice
The purchase price of capital is
A) the value of the capital to the firm.
B) always less than the rental price.
C) the price received from the flow of some capital services.
D) the price a person pays to own that factor of production indefinitely.
F) A) and B)
Correct Answer

verified
Correct Answer
verified
Multiple Choice
José receives a pay raise at his part-time job from $9 to $11 per hour.He used to work 12 hours per week,but now he decides to work 15 hours per week.For this price range,his labor supply curve is
A) vertical.
B) horizontal.
C) upward sloping.
D) backward sloping.
F) B) and C)
Correct Answer

verified
Correct Answer
verified
True/False
Jessica receives a raise at her current part-time job from $9 to $11 per hour.If her labor supply curve is backward sloping,she will work fewer hours after receiving the pay raise.
B) False
Correct Answer

verified
Correct Answer
verified
Multiple Choice
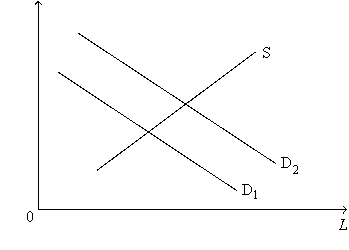
Figure 18-8
This figure below shows the labor market for automobile workers. The curve labeled S is the labor supply curve, and the curves labeled D₁ and D₂ are the labor demand curves. On the horizontal axis, L represents the quantity of labor in the market.
 -Refer to Figure 18-8.Which of the following is a possible explanation of the shift of the labor-demand curve from D₁ to D₂?
A) The wage earned by automobile workers increased.
B) The price of automobiles increased.
C) The opportunity cost of leisure, as perceived by automobile workers, decreased.
D) Large segments of the population changed their tastes regarding leisure versus work.
F) A) and D)
Correct Answer

verified
Correct Answer
verified
Multiple Choice
Factor markets for baked goods are influenced by the
A) demand for baked goods.
B) marginal productivities of labor and capital.
C) market prices for final goods and services.
D) All of the above are correct.
F) B) and C)
Correct Answer

verified
Correct Answer
verified
True/False
When a firm decides to retain its earnings instead of paying dividends,the stockholders necessarily suffer.
B) False
Correct Answer

verified
Correct Answer
verified
Multiple Choice
Scenario 18-2 Gertrude Kelp owns three boats that participate in commercial fishing for fresh Pacific salmon off the coast of Alaska. As part of her business she hires a captain and several crew members for each boat. In the market for fresh Pacific salmon, there are thousands of firms like Gertrude's. While Gertrude usually catches a significant number of fish each year, her contribution to the entire harvest of salmon is negligible relative to the size of the market. -Refer to Scenario 18-2.If the price of fresh Pacific salmon were to decrease significantly,it is most likely that Gertrude would
A) reduce her demand for crew members.
B) hire more boats.
C) become a seller in at least one factor market.
D) hire more crew members.
F) A) and C)
Correct Answer

verified
Correct Answer
verified
Multiple Choice
To maximize profit,a competitive firm hires workers up to the point of intersection of the
A) marginal product curve and the wage line.
B) value of marginal product curve and the wage line.
C) value of marginal product curve and the marginal revenue curve.
D) total revenue curve and the wage line.
F) B) and C)
Correct Answer

verified
Correct Answer
verified
True/False
A firm's demand for labor is derived from its decision to supply a good in another market.
B) False
Correct Answer

verified
Correct Answer
verified
Multiple Choice
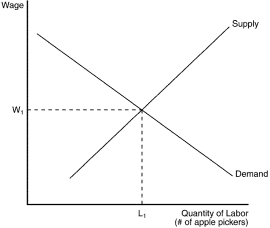
Figure 18-9
 -Refer to Figure 18-9.If the price of apples decreases,the equilibrium wage will
A) increase, and more apple pickers will be hired.
B) decrease, and more apple pickers will be hired.
C) increase, and fewer apple pickers will be hired.
D) decrease, and fewer apple pickers will be hired.
F) A) and B)
Correct Answer

verified
Correct Answer
verified
Multiple Choice
Suppose a labor-augmenting technology were developed for a product that increased the marginal product of labor for all workers.Which of the following would happen in the labor market for this product?
A) Demand would decrease.
B) Demand would increase.
C) Supply would decrease.
D) Supply would increase.
F) A) and C)
Correct Answer

verified
Correct Answer
verified
Multiple Choice
"The firm hires the factor up to the point where the value of the factor's marginal product is equal to the factor's price." This statement applies to which factor of production?
A) labor only
B) land only
C) capital only
D) land, labor, and capital
F) All of the above
Correct Answer

verified
Correct Answer
verified
Multiple Choice
Sarah owns and manages a small coffee shop.We assume that Sarah (i) does not directly care about the quantity of coffee that she sells. (ii) does not directly care about the number of workers that she hires. (iii) wants to maximize the quantity of coffee that she sells. (iv) wants to minimize the number of workers that she hires. (v) wants to maximize profits.
A) (i) and (ii) only
B) (i) , (ii) , and (v) only
C) (iii) and (iv) only
D) (iii) , (iv) , and (v) only
F) A) and B)
Correct Answer

verified
Correct Answer
verified
Multiple Choice
Scenario 18-7 Suppose the following events occur in the market for university economics professors. Event 1: A recession in the U.S. economy lowers the opportunity cost of going to graduate school in economics to become a university economics professor. Event 2: An increasing number of students in U.S. primary and secondary schools increases the number of students entering college, increasing the output price of university economics professors' services. -Refer to Scenario 18-7.As a result of these two events,holding all else constant,the equilibrium quantity of university economics professors will
A) increase.
B) decrease.
C) not change.
D) It is not possible to determine what will happen to the equilibrium quantity.
F) None of the above
Correct Answer

verified
Correct Answer
verified
Multiple Choice
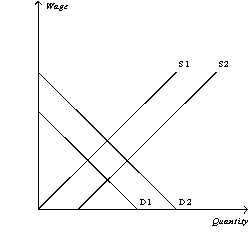
Figure 18-4
 -Refer to Figure 18-4.The graph above illustrates the market for bakers who make homemade breads and breakfast pastries.If bakeries adopt new labor-augmenting technologies,what happens in the market for bakers?
A) Demand increases from D1 to D2.
B) Demand decreases from D2 to D1.
C) Supply increases from S1 to S2.
D) Supply decreases from S2 to S1.
F) A) and D)
Correct Answer

verified
Correct Answer
verified
Multiple Choice
If a worker respond to an increase in the opportunity cost of leisure by taking more leisure,then her labor supply curve is
A) upward sloping.
B) backward sloping.
C) horizontal.
D) vertical.
F) None of the above
Correct Answer

verified
Correct Answer
verified
Multiple Choice
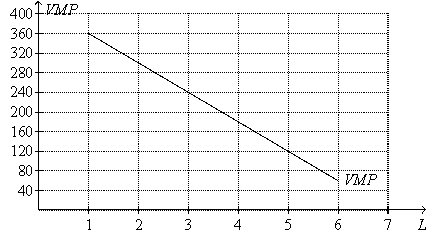
Figure 18-5
The figure shows a particular profit-maximizing, competitive firm's value-of-marginal-product (VMP) curve. On the horizontal axis, L represents the number of workers. The time frame is daily.
 -Refer to Figure 18-5.Suppose the marginal product of the fifth unit of labor is 30 units of output per day.The figure implies that the
A) price of output is $4.
B) price of output is $6.
C) price of output is $8.
D) daily wage is $120.
F) B) and D)
Correct Answer

verified
Correct Answer
verified
Multiple Choice
Which of the following would shift a market labor supply curve to the left?
A) an increase in the wage paid to workers in a competing market
B) labor-saving technology
C) a change in worker tastes so that workers want to retire later
D) an increase in immigration
F) None of the above
Correct Answer

verified
Correct Answer
verified
Multiple Choice
A change in the supply of one factor of production
A) will not change either the marginal productivities or the prices of other factors.
B) will not change the prices of other factors, but it may change their marginal productivities.
C) will not change the marginal productivities of other factors, but it may change their prices.
D) changes the marginal productivities and the prices of other factors.
F) B) and C)
Correct Answer

verified
Correct Answer
verified
Showing 141 - 160 of 463
Related Exams