A) A.
B) C+H.
C) D+H.
D) F.
F) A) and C)
Correct Answer

verified
Correct Answer
verified
True/False
Taxes drive a wedge into the market by raising the price that sellers receive and lowering the price that buyers pay.
B) False
Correct Answer

verified
Correct Answer
verified
Multiple Choice
Table 8-1
 -Refer to Table 8-1.Suppose the government is considering levying a tax in one or more of the markets described in the table.Which of the markets will maximize the deadweight loss(es) from the tax?
A) market B only
B) markets A and C only
C) markets B and D only
D) market D only
F) All of the above
Correct Answer

verified
Correct Answer
verified
True/False
The optimal tax is difficult to determine because although revenues rise and fall as the size of the tax increases,deadweight loss continues to increase.
B) False
Correct Answer

verified
Correct Answer
verified
Multiple Choice
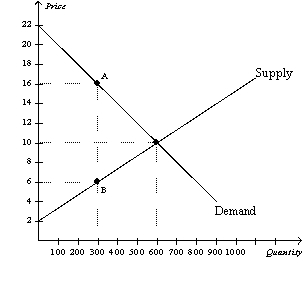
Figure 8-6
The vertical distance between points A and B represents a tax in the market.
 -Refer to Figure 8-6.When the tax is imposed in this market,producer surplus is
A) $450.
B) $600.
C) $900.
D) $1,500.
F) None of the above
Correct Answer

verified
Correct Answer
verified
Multiple Choice
The deadweight loss from a tax
A) does not vary in amount when the price elasticity of demand changes.
B) does not vary in amount when the amount of the tax per unit changes.
C) is larger, the larger is the amount of the tax per unit.
D) is smaller, the larger is the amount of the tax per unit.
F) A) and C)
Correct Answer

verified
Correct Answer
verified
Multiple Choice
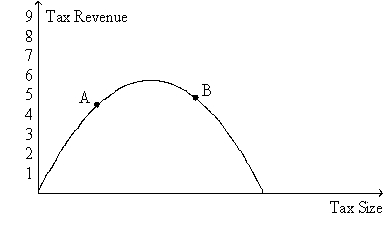
Figure 8-19. The figure represents the relationship between the size of a tax and the tax revenue raised by that tax.
 -Refer to Figure 8-19.According to a recent research paper published by the European Central Bank,which two countries are at a point such as point B if the tax in question is the tax on capital income?
A) the U.S. and the U.K.
B) France and Germany
C) Italy and Spain
D) Denmark and Sweden
F) B) and C)
Correct Answer

verified
Correct Answer
verified
Multiple Choice
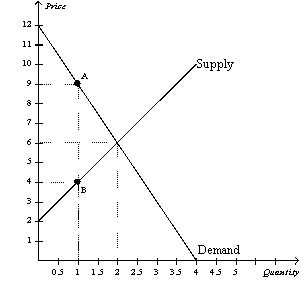
Figure 8-2
The vertical distance between points A and B represents a tax in the market.
 -Refer to Figure 8-2.Producer surplus without the tax is
A) $4, and producer surplus with the tax is $1.
B) $4, and producer surplus with the tax is $3.
C) $10, and producer surplus with the tax is $1.
D) $10, and producer surplus with the tax is $3.
F) A) and C)
Correct Answer

verified
Correct Answer
verified
Multiple Choice
Figure 8-2
The vertical distance between points A and B represents a tax in the market.
 -Refer to Figure 8-2.The amount of the tax on each unit of the good is
A) $1.
B) $4.
C) $5.
D) $9.
F) C) and D)
Correct Answer

verified
Correct Answer
verified
Multiple Choice
Taxes cause deadweight losses because they
A) lead to losses in surplus for consumers and for producers that, when taken together, exceed tax revenue collected by the government.
B) distort incentives to both buyers and sellers.
C) prevent buyers and sellers from realizing some of the gains from trade.
D) All of the above are correct.
F) A) and B)
Correct Answer

verified
Correct Answer
verified
Multiple Choice
When a tax is placed on the buyers of a product,a result is that buyers effectively pay
A) less than before the tax, and sellers effectively receive less than before the tax.
B) less than before the tax, and sellers effectively receive more than before the tax.
C) more than before the tax, and sellers effectively receive less than before the tax.
D) more than before the tax, and sellers effectively receive more than before the tax.
F) A) and D)
Correct Answer

verified
Correct Answer
verified
Multiple Choice
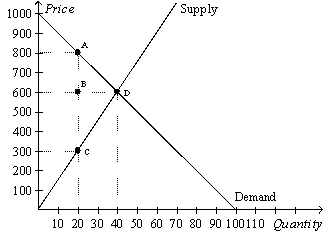
Figure 8-9
The vertical distance between points A and C represent a tax in the market.
 -Refer to Figure 8-9.The consumer surplus with the tax is
A) $2,000.
B) $4,000.
C) $6,000.
D) $8,000.
F) A) and C)
Correct Answer

verified
Correct Answer
verified
Multiple Choice
Figure 8-2
The vertical distance between points A and B represents a tax in the market.
 -Refer to Figure 8-2.The per-unit burden of the tax on sellers is
A) $2.
B) $3.
C) $4.
D) $5.
F) A) and B)
Correct Answer

verified
Correct Answer
verified
Multiple Choice
A tax on a good
A) raises the price that buyers effectively pay and raises the price that sellers effectively receive.
B) raises the price that buyers effectively pay and lowers the price that sellers effectively receive.
C) lowers the price that buyers effectively pay and raises the price that sellers effectively receive.
D) lowers the price that buyers effectively pay and lowers the price that sellers effectively receive.
F) B) and C)
Correct Answer

verified
Correct Answer
verified
Multiple Choice
When a tax is levied on the sellers of a good,the
A) supply curve shifts upward by the amount of the tax.
B) quantity demanded decreases for all conceivable prices of the good.
C) quantity supplied increases for all conceivable prices of the good.
D) None of the above is correct.
F) B) and C)
Correct Answer

verified
Correct Answer
verified
Multiple Choice
A tax levied on the buyers of a good shifts the
A) supply curve upward (or to the left) .
B) supply curve downward (or to the right) .
C) demand curve downward (or to the left) .
D) demand curve upward (or to the right) .
F) A) and B)
Correct Answer

verified
Correct Answer
verified
True/False
The demand for beer is more elastic than the demand for milk,so a tax on beer would have a smaller deadweight loss than an equivalent tax on milk,all else equal.
B) False
Correct Answer

verified
Correct Answer
verified
Multiple Choice
Figure 8-10
![Figure 8-10 -Refer to Figure 8-10.Suppose the government imposes a tax that reduces the quantity sold in the market after the tax to Q2.Without the tax,the total surplus is A) [ x (P0-P5) x Q5] + [ x (P5-0) x Q5]. B) [ x (P0-P2) x Q2] +[(P2-P8) x Q2] + [ x (P8-0) x Q2]. C) (P2-P8) x Q2. D) x (P2-P8) x (Q5-Q2) .](https://d2lvgg3v3hfg70.cloudfront.net/TB2185/11ea33e9_381d_ba09_ac7d_970eb44cd4df_TB2185_00_TB2185_00_TB2185_00_TB2185_00_TB2185_00_TB2185_00_TB2185_00_TB2185_00_TB2185_00_TB2185_00_TB2185_00.jpg) -Refer to Figure 8-10.Suppose the government imposes a tax that reduces the quantity sold in the market after the tax to Q2.Without the tax,the total surplus is
-Refer to Figure 8-10.Suppose the government imposes a tax that reduces the quantity sold in the market after the tax to Q2.Without the tax,the total surplus is
A) [ ![]() x (P0-P5) x Q5] + [
x (P0-P5) x Q5] + [ ![]() x (P5-0) x Q5].
x (P5-0) x Q5].
B) [ ![]() x (P0-P2) x Q2] +[(P2-P8) x Q2] + [
x (P0-P2) x Q2] +[(P2-P8) x Q2] + [ ![]() x (P8-0) x Q2].
x (P8-0) x Q2].
C) (P2-P8) x Q2.
D) ![]() x (P2-P8) x (Q5-Q2) .
x (P2-P8) x (Q5-Q2) .
F) B) and C)
Correct Answer

verified
Correct Answer
verified
Multiple Choice
The size of the deadweight loss generated from a tax is affected by the
A) elasticities of both supply and demand.
B) elasticity of demand only.
C) elasticity of supply only.
D) total revenue collected by the government.
F) A) and C)
Correct Answer

verified
Correct Answer
verified
Multiple Choice
The size of a tax and the deadweight loss that results from the tax are
A) positively related.
B) negatively related.
C) independent of each other.
D) equal to each other.
F) B) and D)
Correct Answer

verified
Correct Answer
verified
Showing 161 - 180 of 424
Related Exams